jmanteau
Mon coin de toile - A piece of Web
The Facets of Ping
This article aims to provide you different ways and tools around “Ping”. By ping, I mean the tooling using icmp to help test, solve and troubleshoot connectivity issues. The section has been divided by “use cases” where the differents tools will be presented to solve a specific problem.
My personal tools of trade are : ping, fping, mtr and mtraceroute. Others tools exists and are listed in the section Others Tools. In particular, you can check the Flyingroutes project if you want to deep dive into how traceroute is working.
[Update 12/2023: I am testing to incorporate https://github.com/fujiapple852/trippy in my toolset]
Summary of use cases:
- Determine the user MTU (IP MTU) with ping
- Check if many hosts are alive with fping or Bash/Ping
- Check the recovery time (failover, cut, recovery, roaming, etc) with fping
- Check the latency toward one host over time with ping, mtr or gping
- Check the path toward the host with traceroute or mtr
- Do a visual traceroute with mtraceroute
- Hear it if the host if off/back with ping
Hosts used as examples below
- 1.1.1.1 : CloudFlare DNS 1
- 1.0.0.1 : CloudFlare DNS 2
- 8.8.8.8 : Google DNS 1
- 8.8.4.4 : Google DNS 2
- 4.2.2.1 : Level 3 DNS 1
- 4.2.2.2 : Level DNS 2
- 192.0.43.10 : Example.com
- 131.107.255.255 : Microsoft NCSI
- example.com
- 0.pool.ntp.org
A file used in input for several tools is generated with:
$ cat <<EOF > input.txt
1.1.1.1
1.0.0.1
8.8.8.8
8.8.4.4
4.2.2.1
4.2.2.2
example.com
131.107.255.255
EOF
Determine the user MTU (IP MTU)
You know that the path is allowing a max MTU lower than what you expect on the path. You need to find it. The command below let you iterate between two values until you find one where it’s not answering anymore. The latest alive is the good one !
ping -D -g 1470 -G 1485 -h 1 -i 0.1 1.1.1.1
PING 1.1.1.1 (1.1.1.1): (1470 ... 1485) data bytes
1478 bytes from 1.1.1.1: icmp_seq=0 ttl=64 time=2.136 ms
1479 bytes from 1.1.1.1: icmp_seq=1 ttl=64 time=2.466 ms
1480 bytes from 1.1.1.1: icmp_seq=2 ttl=64 time=2.420 ms
ping: sendto: Message too long
ping: sendto: Message too long
- -D Set the Don’t Fragment bit.
- -g sweepminsize : Specify the size of ICMP payload to start with when sending sweeping pings. The default value is 0.
- -G sweepmaxsize: Specify the maximum size of ICMP payload when sending sweeping pings.
- -h sweepincrsize: Specify the number of bytes to increment the size of ICMP payload after each sweep when sending sweeping pings. The default value is 1.
- -i wait : Wait wait seconds between sending each packet. The default is to wait for one second between each packet
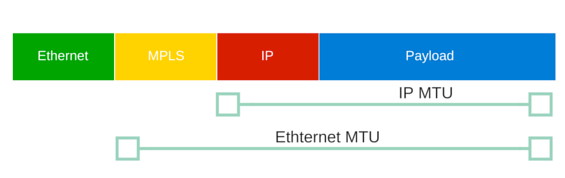
For this use case, we are using an Ethernet underlay (see here in case of LTE or 5G) and we have 1500 of IP MTU (1480 of ICMP + 20 for IP Headers)
Check if many hosts are alive
Fping
fping is a program to send ICMP echo probes to network hosts, similar to ping, but much better performing when pinging multiple hosts. fping has a very long history: Roland Schemers did publish a first version of it in 1992 and it has established itself since then as a standard tool for network diagnostics and statistics.
A simple fping -f input.txt would work but you can tune it a little bit faster with:
   -i, --interval=MSEC  interval between sending ping packets (default: 1 ms)
   -r, --retry=N      number of retries (default: 3)
❯ cat input.txt
1.1.1.1
1.0.0.1
8.8.8.8
8.8.4.4
4.2.2.1
4.2.2.2
example.com
131.107.255.255
165.204.204.242

❯ fping  -r 1 -f input.txt
1.1.1.1 is alive
8.8.8.8 is alive
1.0.0.1 is alive
8.8.4.4 is alive
4.2.2.1 is alive
4.2.2.2 is alive
example.com is alive
131.107.255.255 is unreachable
165.204.204.242 is unreachable
You can play with the options
   -a, --alive        show targets that are alive
   -u, --unreach      show targets that are unreachable
to only print the alive or unreacheable hosts (useful when pinging large numbers of hosts during a migration)
❯ fping -f input.txt -u
131.107.255.255
165.204.204.242

❯ fping -f input.txt -a
1.1.1.1
1.0.0.1
8.8.8.8
8.8.4.4
4.2.2.1
4.2.2.2
example.com
Bash and Ping
If you don’t have ping installed, the poor man’s tool (but always available) is a simple bash script
$ cat << 'EOF' > massping.sh
#!/bin/bash

argc=$#
if [ $# -lt 1 ]
then
   echo "Usage: $0 <ip-list-file>"
   exit 1
fi

hosts=$1

function customping
{
  ping -c 1 -W 1 $1 >/dev/null 2>&1 && echo "$1 is up" || echo "$1 is down"
#  sleep 0.01s
}


DEFAULT_NO_OF_PROC=8
noofproc=$DEFAULT_NO_OF_PROC

if [ -n "$2" ] #user-set no. of process instead of default
then
  noofproc=$2
  echo "Max processes: $noofproc"
fi

while true
do
  echo ''
  date +%H:%M:%S
  export -f customping && cat $hosts | xargs -n 1 -P $noofproc -I{} bash -c 'customping {}' \;
  sleep 1
done

EOF
❯ bash massping.sh input.txt
21:59:12
1.1.1.1 is up
8.8.8.8 is up
1.0.0.1 is up
8.8.4.4 is up
4.2.2.1 is up
4.2.2.2 is up
example.com is up
131.107.255.255 is down

21:59:14
1.1.1.1 is up
1.0.0.1 is up
8.8.8.8 is up
8.8.4.4 is up
4.2.2.1 is up
4.2.2.2 is up
example.com is up
131.107.255.255 is down

21:59:16
1.1.1.1 is up
^C
Check the recovery time (failover, cut, recovery, roaming, etc)
The reason fping is called “fast” is because you can specify the interval between the ping packets down to the millisecond.
We use this to do a continuous ping and calculate the “cut time”.
I’m simulating a small cut on a local target with ìp l set dev ens33 down && sleep 0.04 && ip l set dev ens33 up.
We will use the fping options:
   -l, --loop         loop mode: send pings forever
   -p, --period=MSEC  interval between ping packets to one target (in ms)
                      (in loop and count modes, default: 1000 ms)
   -D, --timestamp    print timestamp before each output line
   -o, --outage       show the accumulated outage time (lost packets * packet interval)
Here we ping continuously every 10ms and print the timestamp at each packet and asked for the cumulated outage time at the end. We can still calculate the individual cut time by using the timestamp.
❯ fping 172.16.181.137 -l -p 10 -D -o
[557843.24942] 172.16.181.137 : [0], 64 bytes, 0.335 ms (0.335 avg, 0% loss)
[557843.25979] 172.16.181.137 : [1], 64 bytes, 0.244 ms (0.289 avg, 0% loss)
[557843.27067] 172.16.181.137 : [2], 64 bytes, 0.233 ms (0.271 avg, 0% loss)
[...]
[557844.13419] 172.16.181.137 : [80], 64 bytes, 0.215 ms (0.476 avg, 0% loss)
[557844.14629] 172.16.181.137 : [81], 64 bytes, 0.698 ms (0.479 avg, 0% loss)
[557844.15593] 172.16.181.137 : [82], 64 bytes, 0.241 ms (0.476 avg, 0% loss)
[557844.17629] 172.16.181.137 : [83], timed out (0.476 avg, 1% loss)
[557844.18682] 172.16.181.137 : [84], timed out (0.476 avg, 2% loss)
[557844.19702] 172.16.181.137 : [85], timed out (0.476 avg, 3% loss)
[557844.20725] 172.16.181.137 : [86], timed out (0.476 avg, 4% loss)
[557844.21926] 172.16.181.137 : [87], timed out (0.476 avg, 5% loss)
[557844.22999] 172.16.181.137 : [88], timed out (0.476 avg, 6% loss)
[557844.24045] 172.16.181.137 : [89], timed out (0.476 avg, 7% loss)
[557844.25207] 172.16.181.137 : [90], timed out (0.476 avg, 8% loss)
[557844.26298] 172.16.181.137 : [91], timed out (0.476 avg, 9% loss)
[557844.27391] 172.16.181.137 : [92], timed out (0.476 avg, 10% loss)
[557844.28457] 172.16.181.137 : [93], timed out (0.476 avg, 11% loss)
[557844.29672] 172.16.181.137 : [94], timed out (0.476 avg, 12% loss)
[557844.30889] 172.16.181.137 : [95], timed out (0.476 avg, 13% loss)
[557844.30947] 172.16.181.137 : [96], 64 bytes, 0.558 ms (0.477 avg, 13% loss)
[557844.32100] 172.16.181.137 : [97], 64 bytes, 0.232 ms (0.474 avg, 13% loss)
[557844.33195] 172.16.181.137 : [98], 64 bytes, 0.486 ms (0.474 avg, 13% loss)
[...]
[557845.13565] 172.16.181.137 : [171], 64 bytes, 0.594 ms (0.531 avg, 7% loss)
^C
172.16.181.137 : xmt/rcv/%loss = 172/159/7%, outage(ms) = 130, min/avg/max = 0.212/0.531/4.99
You can see the time it took to shut/unshut either with calculating the diff of the timestamp or with the cumulative outage time calculated by fping at the end.
Keep in mind that when you use the -p flag the timeout time is less or equal to the period (e.g. if you sed a period of 1 millisecond and the host doesn’t respond within 1 millisecond, then that ping test will be considered as a failed one).
You can adjust this behaviour with the option:
   -t, --timeout=MSEC individual target initial timeout (default: 500 ms,
                      except with -l/-c/-C, where it's the -p period up to 2000 ms)
Example with sending packet every ms but changing the timeout:
❯ fping -l 192.168.1.1 -p 1 -D -t 3
[558096.44057] 192.168.1.1 : [0], timed out (NaN avg, 100% loss)
[...]
[558096.65789] 192.168.1.1 : [20], timed out (NaN avg, 100% loss)
[558096.66834] 192.168.1.1 : [21], timed out (NaN avg, 100% loss)
[558096.67823] 192.168.1.1 : [22], 64 bytes, 2.92 ms (2.92 avg, 95% loss)
[558096.68953] 192.168.1.1 : [23], timed out (2.92 avg, 95% loss)
[558096.69938] 192.168.1.1 : [24], 64 bytes, 2.78 ms (2.85 avg, 92% loss)
[558096.71198] 192.168.1.1 : [25], timed out (2.85 avg, 92% loss)
[558096.72292] 192.168.1.1 : [26], timed out (2.85 avg, 92% loss)
[558096.73393] 192.168.1.1 : [27], timed out (2.85 avg, 92% loss)
[558096.74474] 192.168.1.1 : [28], 64 bytes, 2.76 ms (2.82 avg, 89% loss)
[558096.75631] 192.168.1.1 : [29], timed out (2.82 avg, 90% loss)
[558096.76660] 192.168.1.1 : [30], 64 bytes, 2.95 ms (2.85 avg, 87% loss)
[558096.77725] 192.168.1.1 : [31], timed out (2.85 avg, 87% loss)
[...]
[558098.09303] 192.168.1.1 : [153], timed out (2.86 avg, 87% loss)
[558098.10365] 192.168.1.1 : [154], timed out (2.86 avg, 87% loss)
[558098.11418] 192.168.1.1 : [155], timed out (2.86 avg, 87% loss)
[558098.12540] 192.168.1.1 : [156], timed out (2.86 avg, 87% loss)
[558098.13637] 192.168.1.1 : [157], timed out (2.86 avg, 87% loss)
[558098.14721] 192.168.1.1 : [158], timed out (2.86 avg, 88% loss)
^C
192.168.1.1 : xmt/rcv/%loss = 159/19/88%, min/avg/max = 2.63/2.86/2.98

❯ fping -l 192.168.1.1 -p 1 -D -t 20
[558055.99775] 192.168.1.1 : [0], 64 bytes, 2.03 ms (2.03 avg, 0% loss)
[558056.00885] 192.168.1.1 : [1], 64 bytes, 2.07 ms (2.05 avg, 0% loss)
[...]
[558057.45439] 192.168.1.1 : [135], 64 bytes, 3.77 ms (4.43 avg, 0% loss)
[558057.46721] 192.168.1.1 : [136], 64 bytes, 5.69 ms (4.44 avg, 0% loss)
[558057.47837] 192.168.1.1 : [137], 64 bytes, 5.79 ms (4.45 avg, 0% loss)
^C
192.168.1.1 : xmt/rcv/%loss = 138/138/0%, min/avg/max = 2.03/4.45/11.5
Check the latency toward one host over time
ping
For eye balling a latency, ping is the easiest way:
❯ ping 1.1.1.1                                                                                                    ─╯
PING 1.1.1.1 (1.1.1.1): 56 data bytes
64 bytes from 1.1.1.1: icmp_seq=0 ttl=64 time=4.213 ms
64 bytes from 1.1.1.1: icmp_seq=1 ttl=64 time=1.573 ms
64 bytes from 1.1.1.1: icmp_seq=2 ttl=64 time=1.803 ms
64 bytes from 1.1.1.1: icmp_seq=3 ttl=64 time=3.278 ms
64 bytes from 1.1.1.1: icmp_seq=4 ttl=64 time=2.314 ms
64 bytes from 1.1.1.1: icmp_seq=5 ttl=64 time=21.072 ms
64 bytes from 1.1.1.1: icmp_seq=6 ttl=64 time=4.648 ms
64 bytes from 1.1.1.1: icmp_seq=7 ttl=64 time=2.283 ms
mtr
The MTR (My Traceroute) network monitor combines Ping and Traceroute with the availability measuring capabilities of Ping with the hop-to-hop analysis of Traceroute. MTR uses ICMP packets to measure the availability of devices and the length of time taken to travel from hop to hop.
MTR records packet loss and jitter as well. MTR thus measures the quality of a connection time it takes to complete a transfer and the percentage of packets lost in transit.

You can use D to change the graphical aspect:
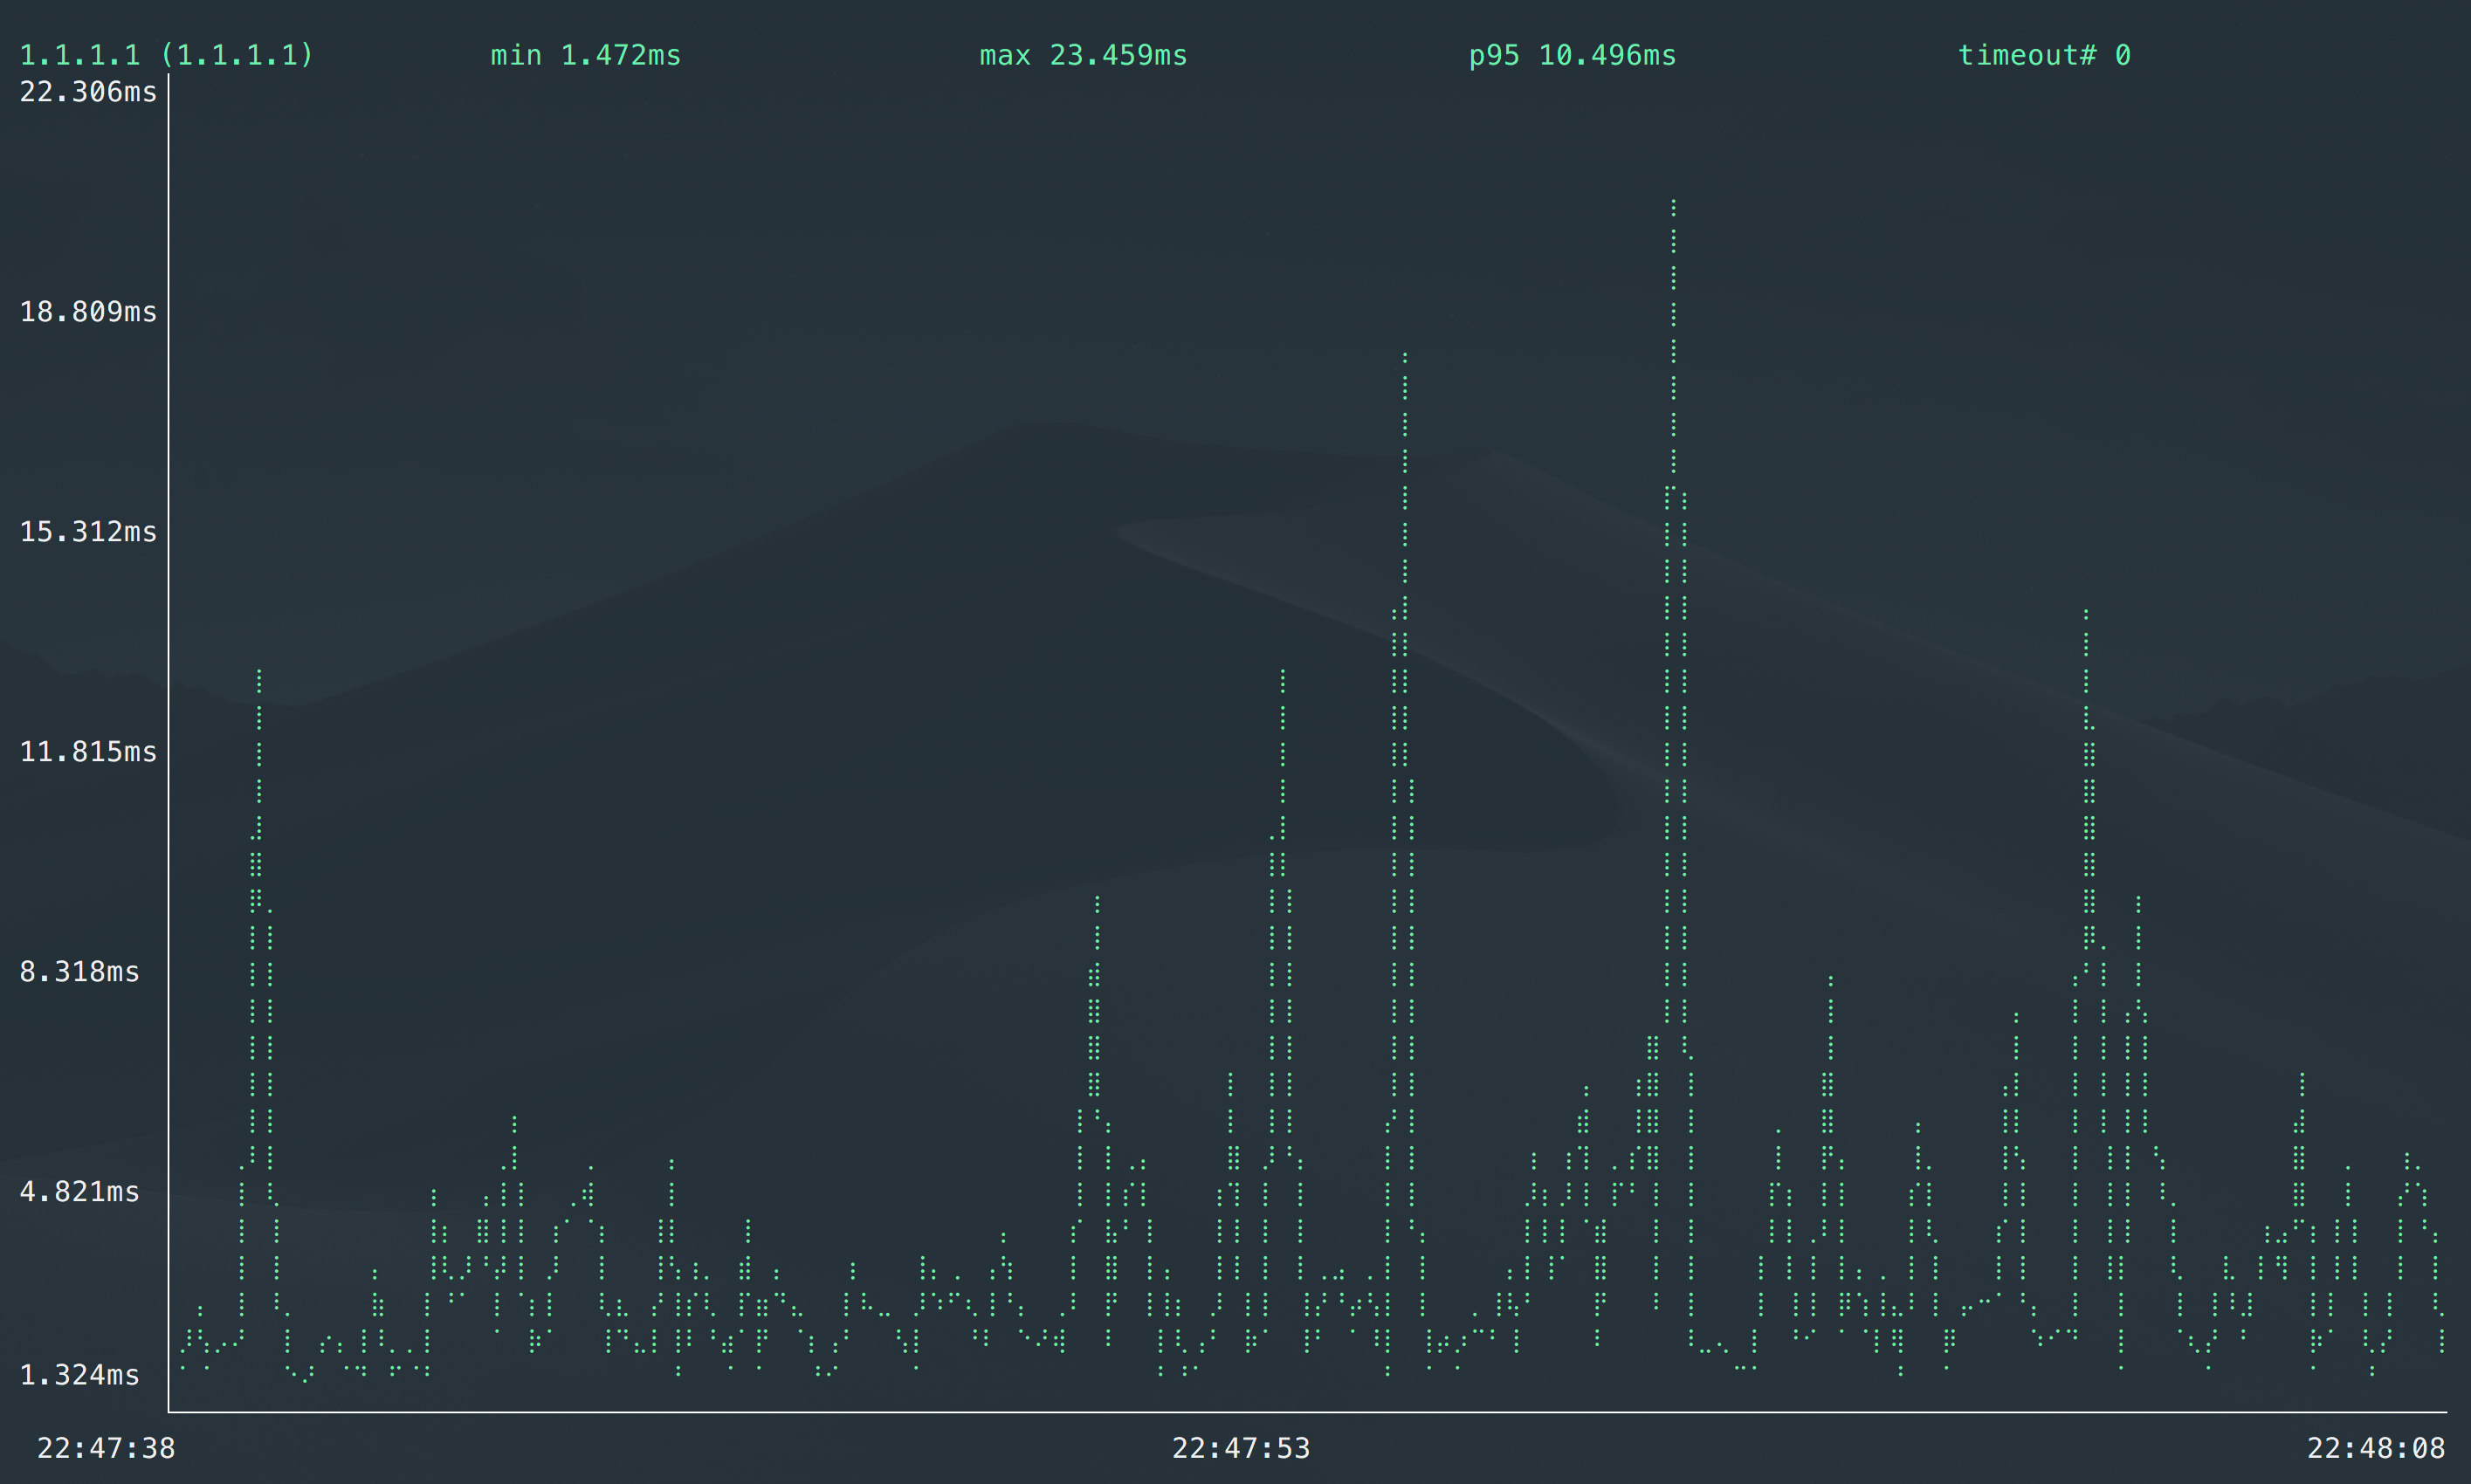
gping
Ping, but with a graph.
While you can use a standard ping and estimate the latency, https://github.com/orf/gping provide a nice CLI live graphical output.
Check the path toward the host
A network path refers to the sequence of network devices a packet passes through in order to reach its destination.
Traceroute
Traceroute or Tracert is a valuable tool for recording the response delays and routing loops existing in a network pathway across packet-switched nodes. The device records the complete path of a network request between two network resources or connections.
Don’t use traceroute as “proof” for packet loss. The only thing traceroute can tell you is pathing. If you’re very lucky, sometimes it might show where the packet loss is on a forward/reverse path.
In 2009 at NANOG 47 Richard A Steenbergen (aka RAS) gave a talk titled: “A Practical Guide to (Correctly) Troubleshooting with Traceroute”.
This presentation is very thorough and breaks down how the tool works, how routers (and their interfaces react), how to interpret the results, and as a result how to use Traceroute to properly troubleshoot. I cannot recommend this presentation highly enough.
Here is the 2020 updated one: 20201020_Steenbergen_Troubleshooting_With_Traceroute_v1.pdf
I usually run traceroute on Mac with -P UDP which is faster to complete than the standard ICMP one
❯ traceroute -P UDP example.com
traceroute to example.com (93.184.216.34), 64 hops max, 52 byte packets
 1  192.168.1.1 (192.168.1.1)  4.318 ms  7.620 ms  11.550 ms
 2  xxxxxxx (xxxxxxxxx)  9.850 ms  16.785 ms  18.249 ms
 3  ae116-0.nctou201.rbci.orange.net (193.249.214.94)  22.149 ms  19.348 ms  8.230 ms
 4  ae43-0.nipoi201.rbci.orange.net (193.252.160.49)  12.853 ms  20.822 ms  16.848 ms
 5  193.252.137.18 (193.252.137.18)  28.647 ms  20.889 ms  19.272 ms
 6  prs-b3-link.ip.twelve99.net (62.115.171.226)  42.218 ms  16.209 ms  23.292 ms
 7  prs-bb1-link.ip.twelve99.net (62.115.118.58)  103.897 ms  98.953 ms
    prs-bb2-link.ip.twelve99.net (62.115.118.62)  99.454 ms
 8  rest-bb1-link.ip.twelve99.net (62.115.122.159)  122.924 ms
    ash-bb2-link.ip.twelve99.net (62.115.112.242)  115.030 ms
    ldn-bb1-link.ip.twelve99.net (62.115.135.24)  98.944 ms
 9  ash-b2-link.ip.twelve99.net (62.115.123.123)  100.320 ms  100.254 ms
    ash-b2-link.ip.twelve99.net (62.115.123.125)  171.338 ms
10  verizon-ic342246-ash-b2.ip.twelve99-cust.net (62.115.175.71)  99.813 ms  99.880 ms  104.520 ms
11  ae-65.core1.dcb.edgecastcdn.net (152.195.64.129)  107.839 ms
    ae-66.core1.dcb.edgecastcdn.net (152.195.65.129)  98.123 ms
    ash-b2-link.ip.twelve99.net (62.115.123.125)  101.752 ms
12  93.184.216.34 (93.184.216.34)  97.986 ms  99.057 ms  107.525 ms
13  93.184.216.34 (93.184.216.34)  99.361 ms  106.103 ms  103.944 ms
MTR
mtr combines the functionality of the ’traceroute’ and ‘ping’ programs in a single network diagnostic tool.
As mtr starts, it investigates the network connection between the host mtr runs on and a user-specified destination host. After it determines the address of each network hop between the machines, it sends a sequence ICMP ECHO requests to each one to determine the quality of the link to each machine. As it does this, it prints running statistics about each machine.
Like traceroute, MTR can use ICMP or UDP for outgoing packets but relies on ICMP for return (Type 11: Time Exceeded) packets.
MTR is fast compared to trace route. For “standard usage” of traceroute, I would recommand mtr when available.
Reporting (ASCII output)
MTR execute by default in a ncurses like CLI with real time refresh. You can ask for an ASCII output with:
❯ mtr --report 8.8.8.8
Start: 2022-03-03T13:24:12+0100
HOST: LOCAL                        Loss%   Snt   Last   Avg  Best  Wrst StDev
  1.|-- 192.168.1.1                0.0%    10    3.7   4.8   3.7   7.5   1.4
  2.|-- 90.20.127.232              0.0%    10    5.2   6.8   5.0  11.8   2.2
  3.|-- ae116-0.ncxxx201.rbci.ora  0.0%    10    5.5   6.4   5.5   8.8   1.0
  4.|-- ae43-0.nipoi201.rbci.oran  0.0%    10   11.3  12.1  11.2  14.5   1.0
  5.|-- ae40-0.nipoi202.rbci.oran  0.0%    10   12.7  14.3  12.1  20.3   2.6
  6.|-- 193.252.137.14             0.0%    10   19.3  19.4  18.2  21.9   1.2
  7.|-- 72.14.210.158              0.0%    10   18.4  20.3  18.1  24.4   2.2
  8.|-- 72.14.236.91              20.0%    10   22.6  26.6  21.0  52.1  10.5
  9.|-- 142.250.224.95             0.0%    10   20.8  22.7  18.3  28.9   3.2
        209.85.244.155
        142.250.234.43
        108.170.234.51
        108.170.236.97
        216.239.48.151
        216.239.48.143
 10.|-- dns.google                 0.0%    10   17.5  19.1  17.0  27.6   3.4
UDP/TCP (instead of ICMP)
By default, mtr uses ICMP. You can ask it to use UDP with -u or TCP with -T and specify a port with -P (by default, it starts at 33000 and goes up for UDP and use 80 for TCP )
Even if UDP or TCP packet are sent on outgoing packets, mtr relies on ICMP for return (Type 11: Time Exceeded) packets.
❯ mtr -u 8.8.8.8 -P 53 --report
Start: 2022-03-03T13:31:06+0100
HOST: XXXXXXXXXXXXXX               Loss%   Snt   Last   Avg  Best  Wrst StDev
  1.|-- 192.168.1.1                0.0%    10    7.2   6.3   3.8   9.4   1.7
  2.|-- ???                       100.0    10    0.0   0.0   0.0   0.0   0.0
  3.|-- xxxxxx                     0.0%    10    5.2   9.5   5.0  26.6   6.4
  4.|-- ae43-0.nipoi201.rbci.oran  0.0%    10   11.5  14.2  11.4  22.9   3.7
  5.|-- ae40-0.nipoi202.rbci.oran  0.0%    10   13.1  13.4  11.7  17.3   2.1
  6.|-- 193.252.137.14            10.0%    10   19.0  23.9  19.0  56.2  12.2
  7.|-- 72.14.202.232              0.0%    10   19.2  20.1  18.5  27.0   2.6
        72.14.210.158
        google-45.gw.opentransit.net
        74.125.50.250
        google-46.gw.opentransit.net
        72.14.198.18
        72.14.218.40
        72.14.202.100
  8.|-- 72.14.235.25               0.0%    10   19.2  20.3  17.4  25.6   2.2
        108.170.244.225
        72.14.236.91
        108.170.244.161
        72.14.233.195
        209.85.255.139
        108.170.235.161
  9.|-- 64.233.174.93              0.0%    10   19.6  20.1  19.0  23.3   1.2
        216.239.59.209
        142.251.49.135
        64.233.174.175
        66.249.94.105
        108.170.234.51
        216.239.48.139
        216.239.48.45
 10.|-- ???                       100.0    10    0.0   0.0   0.0   0.0   0.0
❯ mtr google.com -T -P 443 --report
Start: 2022-03-03T13:41:58+0100
HOST: xxxxx                        Loss%   Snt   Last   Avg  Best  Wrst StDev
  1.|-- 192.168.1.1                0.0%    10    4.9   4.6   1.9  10.5   2.6
  2.|-- ???                       100.0    10    0.0   0.0   0.0   0.0   0.0
  3.|-- ae116-0.nctou201.rbci.ora  0.0%    10    6.0   6.1   3.7   9.9   2.3
  4.|-- ae43-0.nipoi201.rbci.oran  0.0%    10   13.6  11.4  10.1  14.0   1.3
  5.|-- ae40-0.nipoi202.rbci.oran  0.0%    10   12.3  11.8  10.3  16.2   1.7
  6.|-- 193.252.137.14             0.0%    10   21.3  20.9  17.5  31.0   3.9
  7.|-- google-45.gw.opentransit.  0.0%    10   24.8  20.4  16.5  32.7   4.9
        72.14.210.158
        74.125.50.250
        72.14.218.40
        google-46.gw.opentransit.net
        74.125.147.10
  8.|-- 72.14.233.195              0.0%    10   28.4  21.9  15.2  28.4   3.8
        72.14.235.25
        108.170.244.193
        108.170.235.161
        72.14.236.137
  9.|-- 64.233.174.93              0.0%    10   16.3  19.2  15.4  23.7   2.8
        64.233.174.49
 10.|-- par21s05-in-f14.1e100.net  0.0%    10   16.8  22.0  16.8  40.4   7.3
Print IP and AS Numbers
You can add more details in the output such as the IP (in addition of the DNS name) or the AS numbers.
 -z, --aslookup             display AS number
 -b, --show-ips             show IP numbers and host names
 -w, --report-wide          output wide report
The -w is needed for the show-ips option instead of the -r/--report.
❯ mtr example.com -bzw
Start: 2022-03-03T13:52:12+0100
HOST: xxxxx                                                                    Loss%   Snt   Last   Avg  Best  Wrst StDev
  1. AS???    192.168.1.1                                                      0.0%    10    4.0   4.9   3.0  10.1   2.7
  2. AS???    xxxxx                                                            0.0%    10    8.0   6.2   4.5  11.4   2.2
  3. AS???    xxxxx     xxxxx                                                  0.0%    10    6.8   8.5   4.8  22.5   5.5
  4. AS???    ae43-0.nipoi201.rbci.orange.net (193.252.160.49)                 0.0%    10   13.5  12.6  10.3  17.7   2.2
  5. AS???    193.252.137.18                                                  50.0%    10   18.2  15.7  14.6  18.2   1.5
  6. AS1299   prs-b3-link.ip.twelve99.net (62.115.171.226)                    60.0%    10   17.7  17.0  16.0  18.0   1.0
  7. AS1299   prs-bb2-link.ip.twelve99.net (62.115.118.62)                     0.0%    10   94.0  95.4  92.8 103.2   3.4
  8. AS1299   rest-bb1-link.ip.twelve99.net (62.115.122.159)                   0.0%    10   93.8  94.2  92.6  96.5   1.4
  9. AS1299   ash-b2-link.ip.twelve99.net (62.115.123.123)                     0.0%    10   94.1  95.4  92.4 102.8   3.4
 10. AS1299   verizon-ic-315152-ash-b1.ip.twelve99-cust.net (213.248.83.119)   0.0%    10   97.3 100.9  93.7 121.2   8.8
 11. AS15133  ae-66.core1.dcb.edgecastcdn.net (152.195.65.129)                 0.0%    10   93.8  96.9  92.9 118.8   8.2
 12. AS15133  93.184.216.34                                                    0.0%    10   91.7  93.6  91.7  98.0   1.8
Only print part of the path
If you need to only inspect part of the path, you can use the following options (one or both at the same time):
 -f, --first-ttl NUMBER     set what TTL to start
 -m, --max-ttl NUMBER       maximum number of hops
❯ mtr example.com -bzw --first-ttl=6  --max-ttl=10
Start: 2022-03-03T13:54:29+0100
HOST: xxxxx                                                                   Loss%   Snt   Last   Avg  Best  Wrst StDev
  6. AS1299   prs-b3-link.ip.twelve99.net (62.115.171.226)                    80.0%    10   15.9  15.7  15.5  15.9   0.3
  7. AS1299   prs-bb2-link.ip.twelve99.net (62.115.118.62)                     0.0%    10   93.4  95.1  92.7 100.2   2.5
  8. AS1299   rest-bb1-link.ip.twelve99.net (62.115.122.159)                   0.0%    10   94.6  94.5  93.3  96.4   1.0
  9. AS1299   ash-b2-link.ip.twelve99.net (62.115.123.123)                     0.0%    10   92.3  94.5  92.3  97.0   1.8
 10. AS1299   verizon-ic-315152-ash-b1.ip.twelve99-cust.net (213.248.83.119)   0.0%    10   98.3  98.9  93.7 110.9   5.4
Reduce the load
You can use the -i, --interval SECONDS ICMP echo request intervaloption to be less ‘aggressive’ on the router on the path and reduce the impact of potential ICMP rate limiting (you can check the hop 6 in the example below)
❯ mtr example.com -bzw --first-ttl=6  --max-ttl=10
Start: 2022-03-03T13:54:29+0100
HOST: TOLA302006216                                                           Loss%   Snt   Last   Avg  Best  Wrst StDev
  6. AS1299   prs-b3-link.ip.twelve99.net (62.115.171.226)                    80.0%    10   15.9  15.7  15.5  15.9   0.3
  7. AS1299   prs-bb2-link.ip.twelve99.net (62.115.118.62)                     0.0%    10   93.4  95.1  92.7 100.2   2.5
  8. AS1299   rest-bb1-link.ip.twelve99.net (62.115.122.159)                   0.0%    10   94.6  94.5  93.3  96.4   1.0
  9. AS1299   ash-b2-link.ip.twelve99.net (62.115.123.123)                     0.0%    10   92.3  94.5  92.3  97.0   1.8
 10. AS1299   verizon-ic-315152-ash-b1.ip.twelve99-cust.net (213.248.83.119)   0.0%    10   98.3  98.9  93.7 110.9   5.4
                                                                                                                                          Took 11s

❯ mtr example.com -bzw --first-ttl=6  --max-ttl=10 --interval=10
Start: 2022-03-03T13:55:48+0100
HOST: TOLA302006216                                                           Loss%   Snt   Last   Avg  Best  Wrst StDev
  6. AS1299   prs-b3-link.ip.twelve99.net (62.115.171.226)                    60.0%    10   14.6  16.4  14.6  18.2   1.5
  7. AS1299   prs-bb2-link.ip.twelve99.net (62.115.118.62)                     0.0%    10   93.2  93.8  92.3  96.8   1.5
  8. AS1299   rest-bb1-link.ip.twelve99.net (62.115.122.159)                   0.0%    10   92.6  95.1  92.6  98.2   1.8
  9. AS1299   ash-b2-link.ip.twelve99.net (62.115.123.123)                     0.0%    10   93.9  94.0  91.9  97.8   1.7
 10. AS1299   verizon-ic-315152-ash-b1.ip.twelve99-cust.net (213.248.83.119)   0.0%    10  115.4  97.3  92.2 115.4   7.9
                                                                                                                                          Took 57s

❯ mtr example.com -bzw --first-ttl=6  --max-ttl=10 --interval=15
Start: 2022-03-03T13:57:43+0100
HOST: TOLA302006216                                                           Loss%   Snt   Last   Avg  Best  Wrst StDev
  6. AS1299   prs-b3-link.ip.twelve99.net (62.115.171.226)                    30.0%    10   19.8  16.9  14.0  20.1   2.3
  7. AS1299   prs-bb2-link.ip.twelve99.net (62.115.118.62)                     0.0%    10   97.8  96.2  93.6 106.6   3.9
  8. AS1299   rest-bb1-link.ip.twelve99.net (62.115.122.159)                   0.0%    10   94.2  94.2  93.0  96.3   1.0
  9. AS1299   ash-b2-link.ip.twelve99.net (62.115.123.123)                     0.0%    10   93.3  95.5  93.1 102.3   2.9
 10. AS1299   verizon-ic-315152-ash-b1.ip.twelve99-cust.net (213.248.83.119)   0.0%    10   94.0  95.2  93.2  99.8   2.1

Took 1m 23s
Ping (for information)
Ping provide a quick way to provide the network path. However this need a special option on the ICMP packet and it is frequently dropped on the Internet or enterprise networks.
 -R      Record route.  Includes the RECORD_ROUTE option in the ECHO_REQUEST
         packet and displays the route buffer on returned packets.  Note that
         the IP header is only large enough for nine such routes; the
         traceroute(8) command is usually better at determining the route pack-
         ets take to a particular destination.  If more routes come back than
         should, such as due to an illegal spoofed packet, ping will print the
         route list and then truncate it at the correct spot.  Many hosts
         ignore or discard the RECORD_ROUTE option.
PING 192.168.1.63 (192.168.1.63) 56(84) bytes of data.
64 bytes from 192.168.1.63: icmp_seq=1 ttl=61 time=2.05 ms
RR:   192.168.9.118
        192.168.3.25
        192.168.10.35
        192.168.1.26
        192.168.1.63
        192.168.1.63
        192.168.10.4
        192.168.3.10
        192.168.4.25
64 bytes from 192.168.1.63: icmp_seq=2 ttl=61 time=2.00 ms      (same route)
Emulate traceroute principle with Ping
From https://web.archive.org/web/20220219055131/https://susam.net/maze/toy-traceroute-with-ping.html
Here is an example of a toy traceroute using ping on Linux:
$ for ttl in {1..30}; do ping -4 -c 1 -t $ttl example.com && break; done | grep -i from | nl -s ' ' -w 2
 1 From router1-lon.linode.com (212.111.33.229) icmp_seq=1 Time to live exceeded
 2 From if-0-1-0-0-0.gw1.lon1.gb.linode.com (109.74.207.10) icmp_seq=1 Time to live exceeded
 3 From be5787.rcr51.lon10.atlas.cogentco.com (204.68.252.58) icmp_seq=1 Time to live exceeded
 4 From be2589.ccr41.lon13.atlas.cogentco.com (154.54.59.37) icmp_seq=1 Time to live exceeded
 5 From be2099.ccr31.bos01.atlas.cogentco.com (154.54.82.34) icmp_seq=1 Time to live exceeded
 6 From verizondms.bos01.atlas.cogentco.com (154.54.11.54) icmp_seq=1 Time to live exceeded
 7 From ae-66.core1.bsa.edgecastcdn.net (152.195.233.129) icmp_seq=1 Time to live exceeded
 8 64 bytes from 93.184.216.34 (93.184.216.34): icmp_seq=1 ttl=57 time=63.0 ms
The output above was obtained on a Debian GNU/Linux 11.2 (bullseye) system. The above loop sends multiple ICMP echo requests with different Time to Live (TTL) values to reach the host for example.com. The TTL occurs as an 8-bit field in the Internet Protocol (IP) header of each packet. It is the 9th octet in an IPv4 header and the 8th octet in an IPv6 header.
When a router on the path to the destination receives a packet, it decrements the TTL value in the IP header by one. If the TTL value becomes 0 after the decrement operation, the router responds with a “time-to-live exceeded” ICMP message. Thus an echo request with TTL value set to 1 gets us an ICMP “time-to-live exceeded” message from the first router in the path, the next echo request with TTL value 2 gets us a similar ICMP message from the second router in the path, and so on. The traceroute is complete when we receive a successful ICMP echo reply.
The route found by the toy traceroute using ping is one of the several routes found by the traceroute command.
For those on macOS, the ping command options need to be modified as follows:
for ttl in {1..30}; do ping -c 1 -t 1 -m $ttl example.com && break; done | grep -i from | nl -s ' ' -w 2
On macOS, the -t option of the ping command specifies a timeout (not IP TTL) that prevents it from waiting for too long for a successful echo reply which we don’t expect to receive. Further, on macOS, the -m option of the ping command specifies the IP TTL.
Do a visual traceroute
Traceroute or MTR are nice but sometimes you need to gather several traceroutes in one. While MTR and Traceroute are able to show parallel paths they cannot correlate inputs from several traceroutes.
Scapy is the perfect tool for that. There is a basic implementation of TCP traceroute on the documentation and easily find a lot of others by search “traceroute scapy”.
My favourite implentation is the one NST uses inside their distribution. You can allow find it as standalone like explained below.
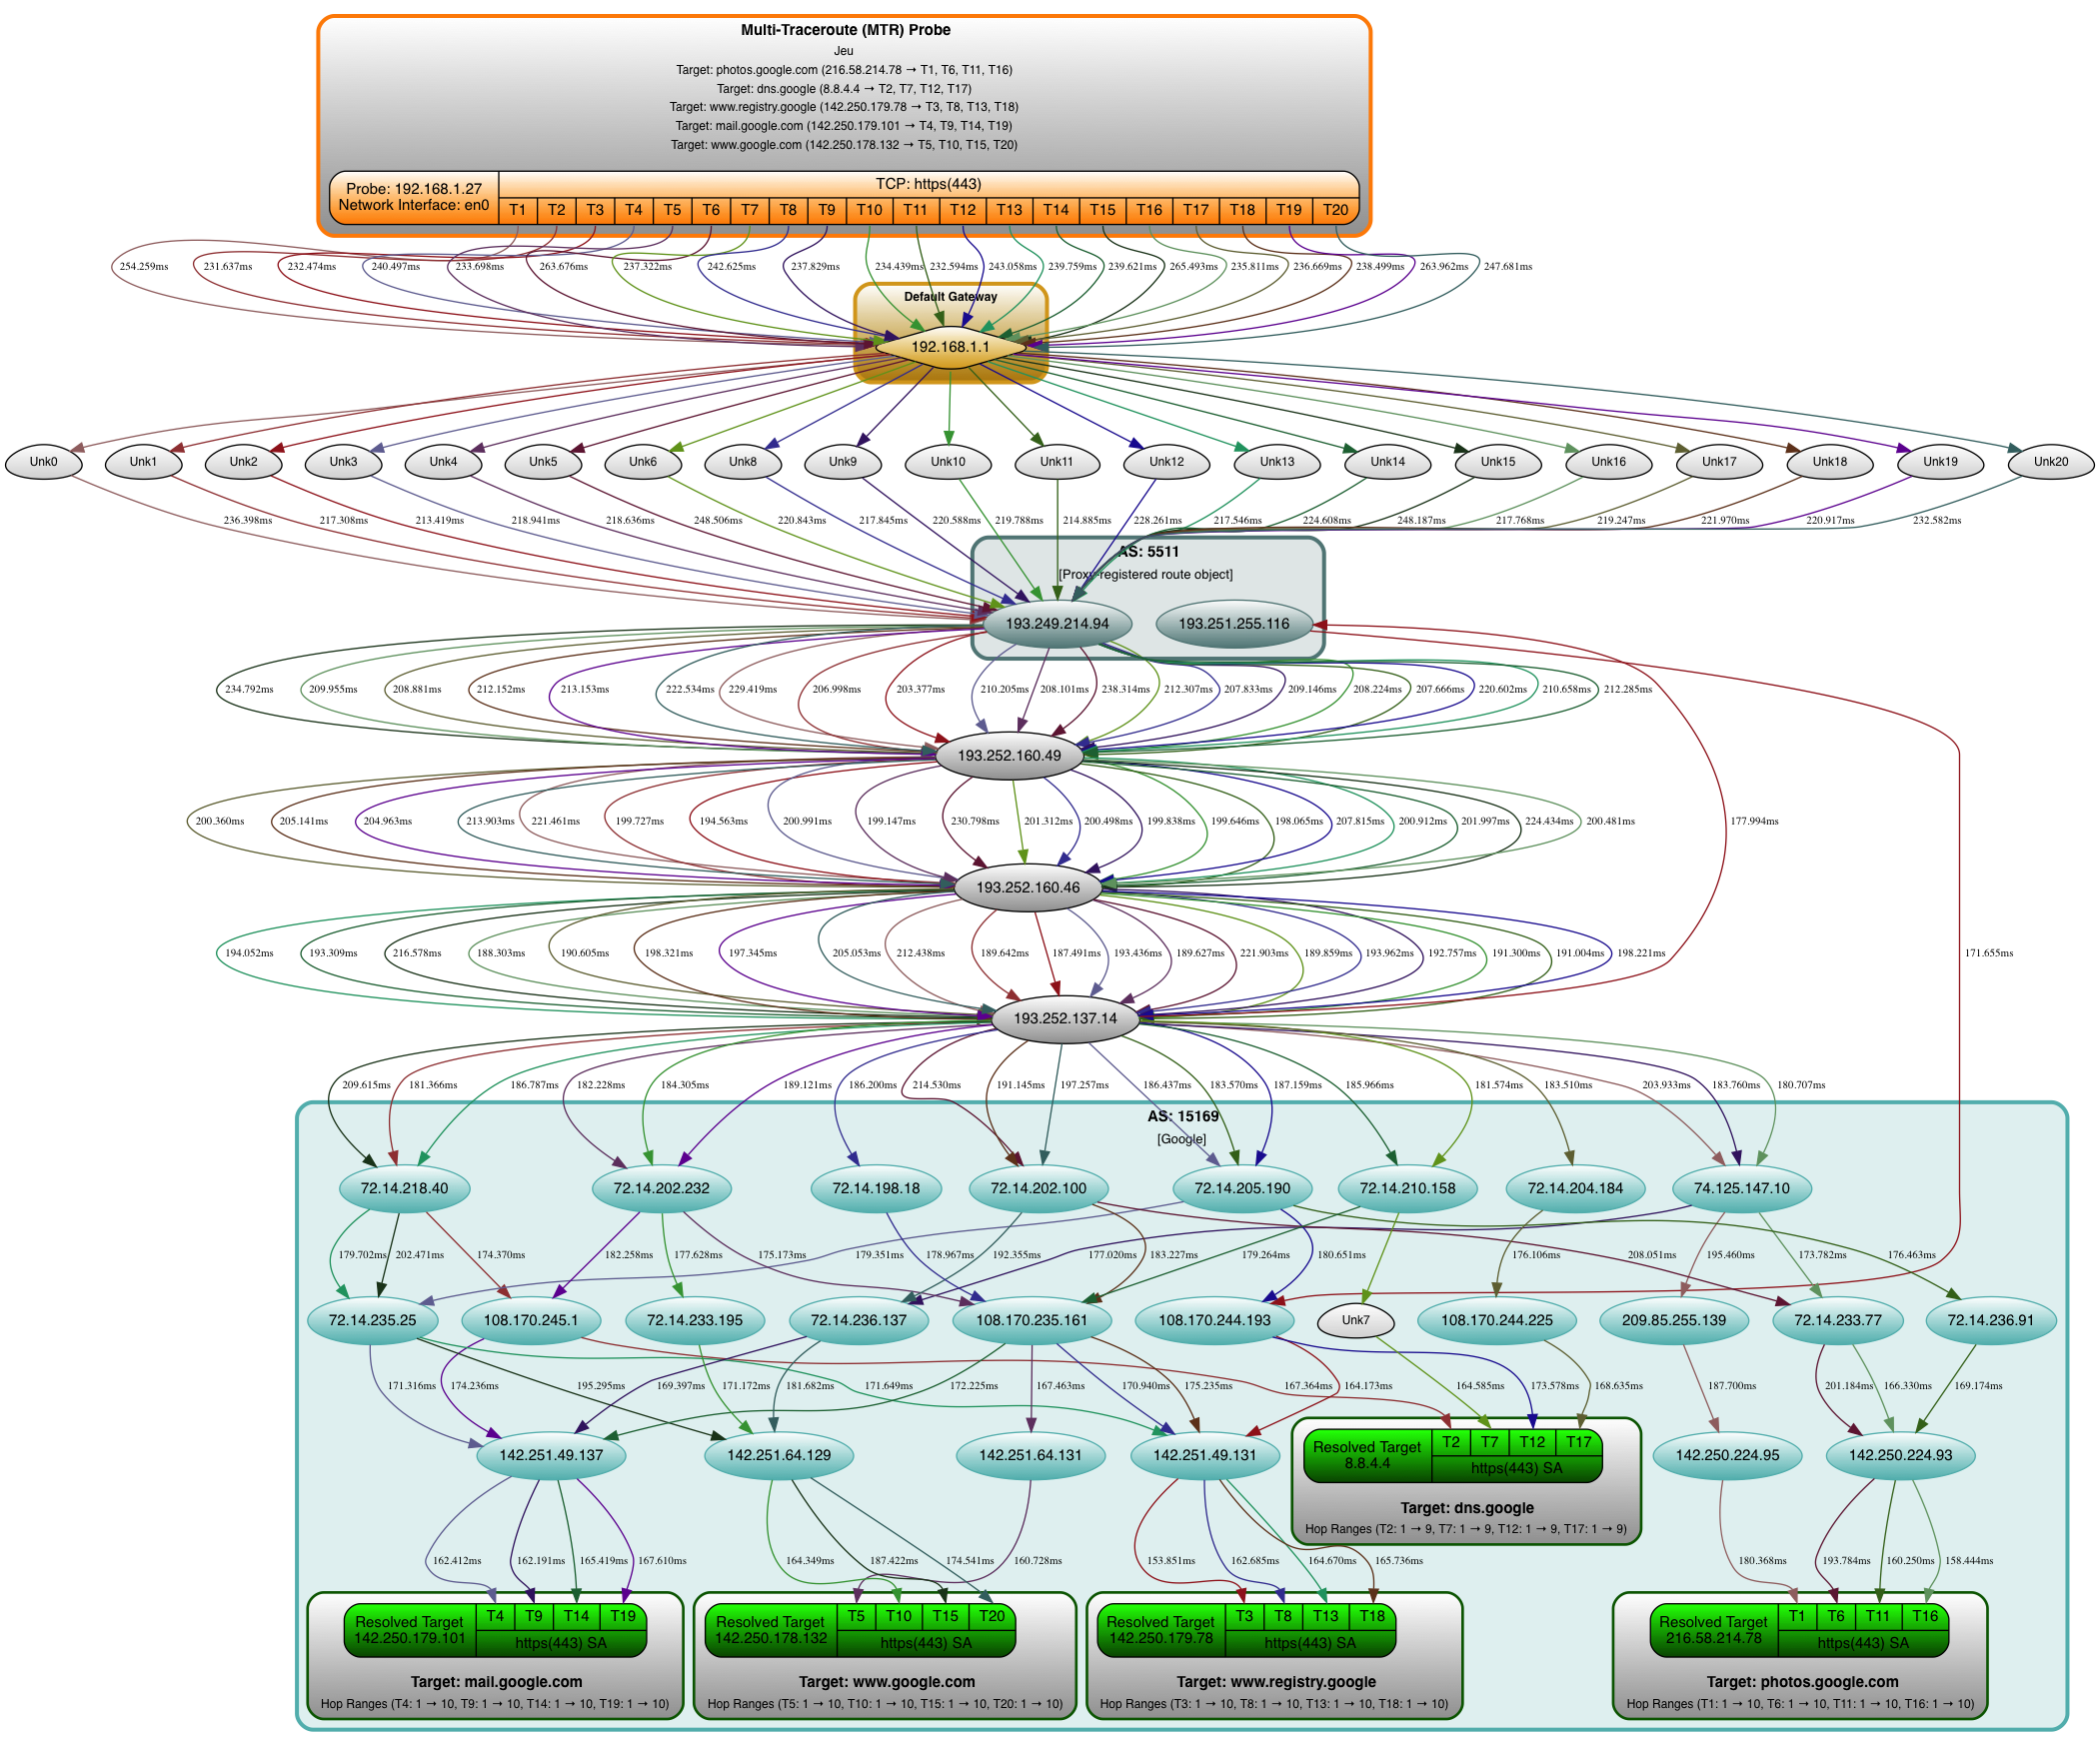
mtraceroute
A python3 library for performing an enhanced scapy Multi-Traceroute (MTR) with a resulting SVG.
Features include running multiple queries with each target, display of Round Trip Time (RTT) calculations, selection of using Network Protocols: TCP, UDP and ICMP and with enhanced scapy SVG visual results and session packet capture output.
The upstream repo has some issues installation so I forked it to correct it: (jmanteau/mtraceroute)
Here is two examples.
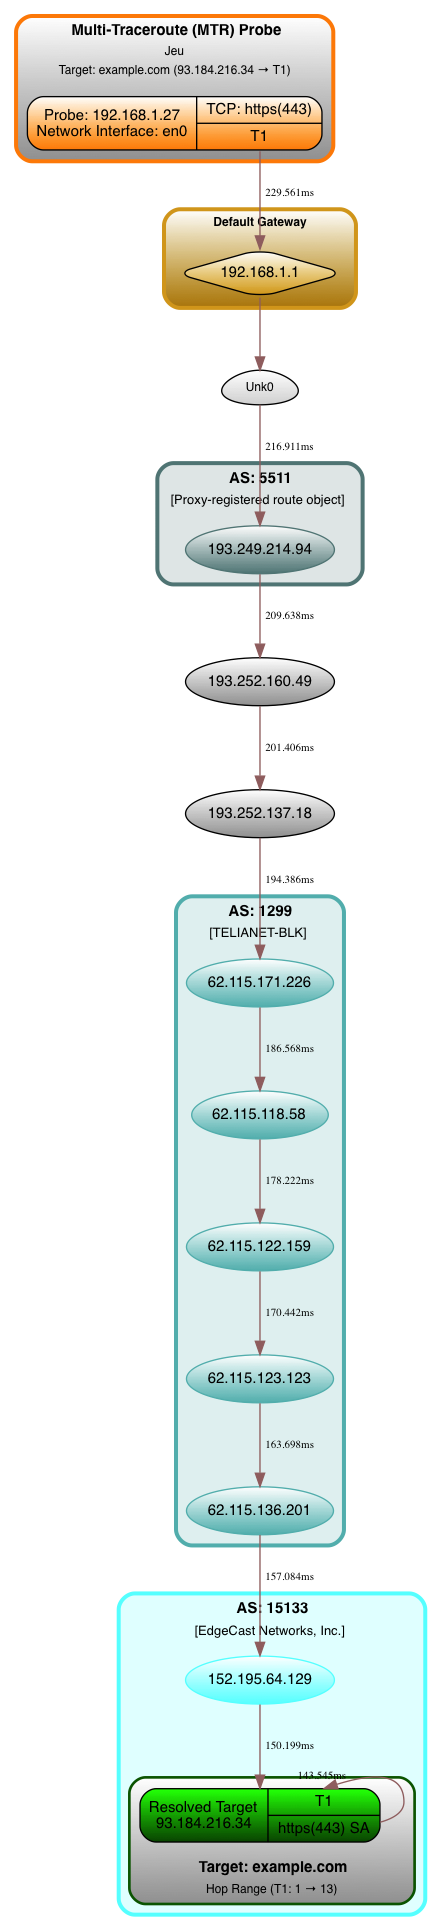
First one is one target only with one trace (more or less a visual traceoute/mtr):
❯ mtrrt \
  --targets 'example.com' \
  --dirfile '/tmp/scapy.svg' --nquery 1 --interface 'en0' \
  --netproto 'TCP' --dports '443' \
  --retry 0 --minttl 1 --maxttl 30 --asnresolver 'All' --verbose 1 \
  --stype 'Random' --dotfile --rtt --privaddr --ptype 'Disabled' \
  --vspread 0.75 --title 'Multi-Traceroute (MTR) Probe' --ts $(date) --timeout 2 2>&1;
Second one is multi target with several traces (which is where mtraceroute is shining):
❯ mtrrt \
  --targets 'photos.google.com,dns.google,www.registry.google,mail.google.com,www.google.com' \
  --dirfile '/tmp/scapy.svg' --nquery 4 --interface 'en0' \
  --netproto 'TCP' --dports '443' \
  --retry 0 --minttl 1 --maxttl 30 --asnresolver 'All' --verbose 1 \
  --stype 'Random' --dotfile --rtt --privaddr --ptype 'Disabled' \
  --vspread 0.75 --title 'Multi-Traceroute (MTR) Probe' --ts $(date) --timeout 2 2>&1;
Hear it if the host if off or back
The audible ping gives a beep when the peer is reachable
This option is useful during troubleshooting. There is no need for you to look at the ping output after each and every change. You can continue working with your changes, and when the remote machine become reachable/unreacheable you’ll hear the beep automatically.
 -A      Audible.  Output a bell (ASCII 0x07) character when no packet is received before the next
         packet is transmitted.  To cater for round-trip times that are longer than the interval between
         transmissions, further missing packets cause a bell only if the maximum number of unreceived
         packets has increased.

 -a      Audible.  Include a bell (ASCII 0x07) character in the output when any packet is received.
         This option is ignored if other format options are present.
ping -a IP # Beep if the host is back/there
ping -A IP # Beep when the host is down/not answering
Others Tools
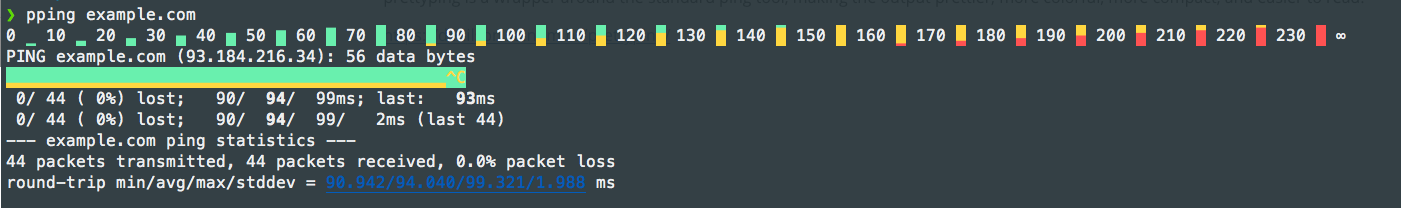
PrettyPing
prettyping is a wrapper around the standard ping tool, making the output prettier, more colorful, more compact, and easier to read.
Hping
hping is a command-line oriented TCP/IP packet assembler/analyzer. The interface is inspired to the ping(8) unix command, but hping isn’t only able to send ICMP echo requests. It supports TCP, UDP, ICMP and RAW-IP protocols, has a traceroute mode, the ability to send files between a covered channel, and many other features.
While hping was mainly used as a security tool in the past, it can be used in many ways by people that don’t care about security to test networks and hosts. A subset of the stuff you can do using hping:
- Firewall testing
- Advanced port scanning
- Network testing, using different protocols, TOS, fragmentation
- Manual path MTU discovery
- Advanced traceroute, under all the supported protocols
- Remote OS fingerprinting
- Remote uptime guessing
- TCP/IP stacks auditing
- hping can also be useful to students that are learning TCP/IP.
For more details, please refer to the Hping wiki or this article
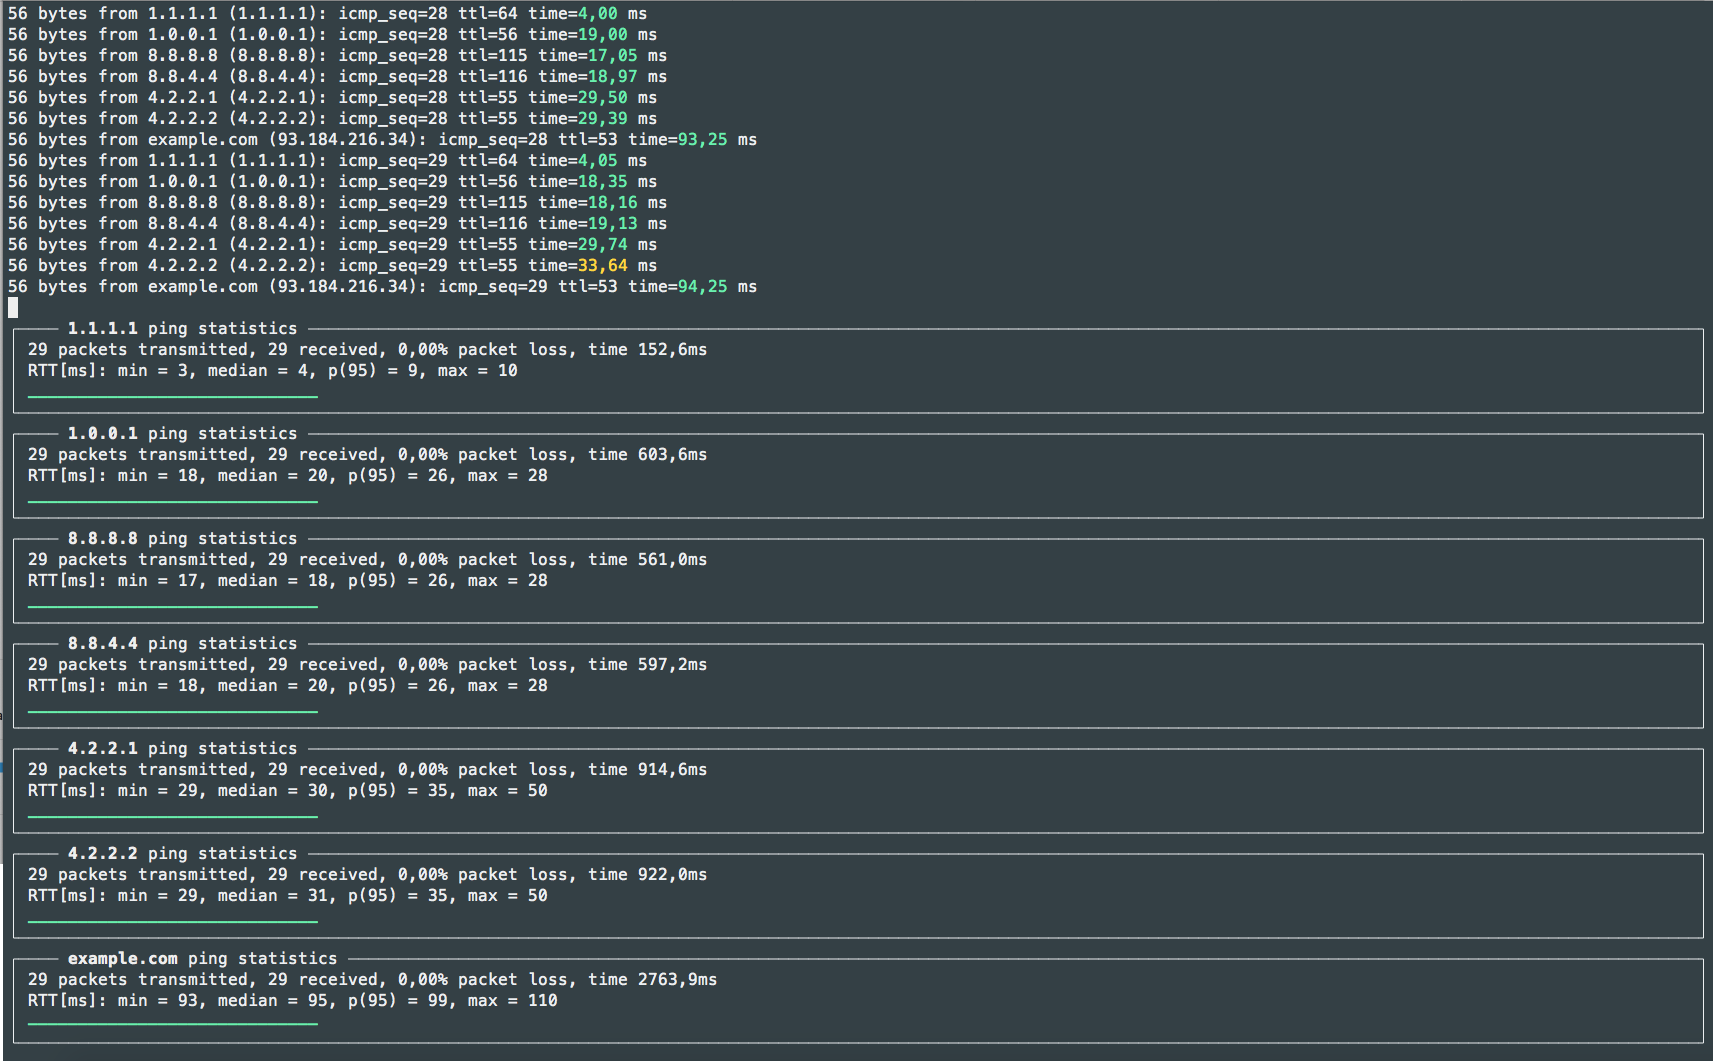
liboping: Oping/Noping
liboping was inspired by ping, libping and fping: It differs from these existing solutions in that it can “ping” multiple hosts in parallel using IPv4 or IPv6 transparently. Other design principles were an object oriented interface, simplicity and extensibility.
On top of liboping two command line applications have been built. “oping” is a drop-in replacement for ping(1) with very similar output. “noping” is an ncurses-based application which displays statistics while pinging and highlights aberrant round-trip times.
Oping:
❯ sudo oping -f input.txt
PING 1.1.1.1 (1.1.1.1) 56 bytes of data.
PING 1.0.0.1 (1.0.0.1) 56 bytes of data.
PING 8.8.8.8 (8.8.8.8) 56 bytes of data.
PING 8.8.4.4 (8.8.4.4) 56 bytes of data.
PING 4.2.2.1 (4.2.2.1) 56 bytes of data.
PING 4.2.2.2 (4.2.2.2) 56 bytes of data.
PING example.com (93.184.216.34) 56 bytes of data.
56 bytes from 1.1.1.1 (1.1.1.1): icmp_seq=1 ttl=64 time=14,35 ms
56 bytes from 1.0.0.1 (1.0.0.1): icmp_seq=1 ttl=56 time=18,88 ms
56 bytes from 8.8.8.8 (8.8.8.8): icmp_seq=1 ttl=115 time=18,81 ms
56 bytes from 8.8.4.4 (8.8.4.4): icmp_seq=1 ttl=116 time=19,73 ms
56 bytes from 4.2.2.1 (4.2.2.1): icmp_seq=1 ttl=55 time=34,10 ms
56 bytes from 4.2.2.2 (4.2.2.2): icmp_seq=1 ttl=55 time=34,02 ms
56 bytes from example.com (93.184.216.34): icmp_seq=1 ttl=53 time=95,84 ms
56 bytes from 1.1.1.1 (1.1.1.1): icmp_seq=2 ttl=64 time=4,29 ms
56 bytes from 1.0.0.1 (1.0.0.1): icmp_seq=2 ttl=56 time=18,97 ms
56 bytes from 8.8.8.8 (8.8.8.8): icmp_seq=2 ttl=115 time=17,99 ms
56 bytes from 8.8.4.4 (8.8.4.4): icmp_seq=2 ttl=116 time=18,75 ms
56 bytes from 4.2.2.1 (4.2.2.1): icmp_seq=2 ttl=55 time=29,21 ms
56 bytes from 4.2.2.2 (4.2.2.2): icmp_seq=2 ttl=55 time=30,46 ms
56 bytes from example.com (93.184.216.34): icmp_seq=2 ttl=53 time=93,81 ms
56 bytes from 1.1.1.1 (1.1.1.1): icmp_seq=3 ttl=64 time=7,59 ms
56 bytes from 1.0.0.1 (1.0.0.1): icmp_seq=3 ttl=56 time=18,33 ms
56 bytes from 8.8.8.8 (8.8.8.8): icmp_seq=3 ttl=115 time=18,19 ms
56 bytes from 8.8.4.4 (8.8.4.4): icmp_seq=3 ttl=116 time=19,03 ms
56 bytes from 4.2.2.1 (4.2.2.1): icmp_seq=3 ttl=55 time=35,51 ms
56 bytes from 4.2.2.2 (4.2.2.2): icmp_seq=3 ttl=55 time=35,46 ms
56 bytes from example.com (93.184.216.34): icmp_seq=3 ttl=53 time=94,79 ms
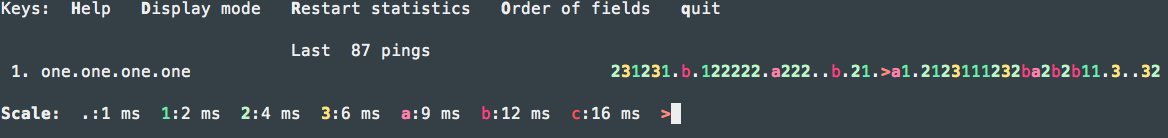
Noping:
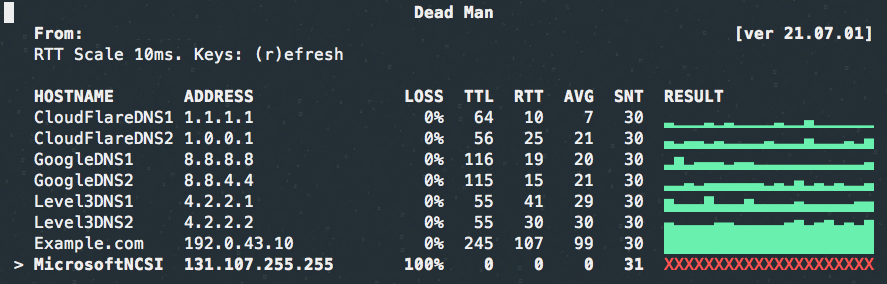
Deadman
deadman is a curses-based host status checking application using ping . It is nice for a small amout of host as it add a graphical summary.
$ git clone https://github.com/upa/deadman
$ cd deadman
$ cat <<EOF > deadman.conf
CloudFlareDNS1 1.1.1.1
CloudFlareDNS2 1.0.0.1
GoogleDNS1 8.8.8.8
GoogleDNS2 8.8.4.4
Level3DNS1 4.2.2.1
Level3DNS2 4.2.2.2
Example.com 192.0.43.10
MicrosoftNCSI 131.107.255.255
EOF
Flyingroutes
Flyingroutes is a faster Python 3 implementation of the famous traceroute tool by using asynchronous TTL probing with either UDP, TCP or ICMP. Unprivileged sockets are used when possible depending on the platform, otherwise privilege sockets are used.
You don’t have to wait anymore for your traceroute command to end as you get instantaneous results!
Comparison between tools (from Prettyping page)
| ping | mtr | oping | prettyping | |
|---|---|---|---|---|
| Programming language | C | C | C | bash and awk |
| How easy to install from scratch? | Should already come with your system | Medium (C compiler + root privileges) | Medium (C compiler + ncurses + root privileges) | Trivial (just one file) |
| Requires root to install? | Yes (suid) | Yes (suid) | Yes (suid) | No (wrapper for ping, which is suid) |
| How many hosts? | One | All hosts in path | One or more | One |
| Minimum ping interval | 0.2s for non-root users | 1.0s for non-root users | 0.001s | The same as ping or oping |
| How easy to read the latency? | Precise individual values are printed, average is only printed upon exit | Statistics for each host are updated on each response, plus a non-intuitive legend for the graph | oping: Looks the same as ping noping: Enhances the normal output with colors and live statistics and prettyping-inspired graphics |
Statistics for each host are updated on each response, plus an intuitive and colorful graph |
| How easy to see lost packets? | Hard (lost packages aren’t printed on the Linux ping) |
Easy (? at the graphic, plus listed in the statistics) |
Very easy (oping prints missing responses, noping additionally shows them in the graph) |
Very easy (red ! at the graphic, plus listed in the statistics) |
| Statistics | Only shown upon exit | Updated in real-time, considers all responses since the beginning of the run | oping: Only shown upon exit noping: Updated in real-time, considers all responses since the beginning of the run |
Updated in real-time, shows statistics for all responses since the beginning of the run, as well as statistics for the most recent 60 responses |
| Can redirect output to file? | Yes | No | oping: Yes noping: No |
Yes |
| Terminal behavior | Standard output | Curses full-screen app | oping: Standard output noping: Curses full-screen app |
Standard output with optional colors and VT100 escapes |
| Terminal dimensions | Ignores the terminal size | Reacts immediately to the terminal size | oping: Ignores the terminal size noping: Adapts to the terminal size |
Adapts to the terminal size (only the future responses, the past responses are not changed) |